【python】相関係数行列をstatsmodelsを使って描く
はじめに
相関係数行列を描く方法としては、pandasとseabornを使う方法などが一般的です。しかし、statsmodelsで行う方法も実は存在します。
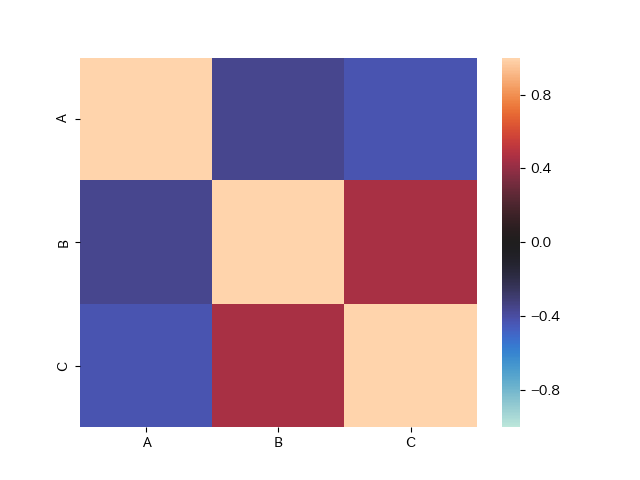
pandas+seabornでやる場合
import numpy as np
import pandas as pd
import matplotlib.pyplot as plt
import seaborn as sns

np.random.seed(0)
df = pd.DataFrame({"A":np.random.randint(0, 10, size=(10,)),
                   "B":np.random.randint(0, 10, size=(10,)),
                   "C":np.random.randint(0, 10, size=(10,))})

df_corr = df.corr()
sns.heatmap(df_corr, vmax=1, vmin=-1, center=0)
plt.savefig("pandas_cm.png")

参考:pandas.DataFrameの各列間の相関係数を算出、ヒートマップで可視化 | note.nkmk.me
というか相関係数の記事を書くときにstatsmodelsのリファレンスを検索していたらこれを見つけたので、試してみようと思った次第です。どれくらい使い物になるのでしょうか。
使い方
ずばり、これです。
statsmodels.graphics.correlation.plot_corr — statsmodels v0.10.1 documentation
名前が覚えづらいのが最大の難点で、他は普通に使えます。というか、seaborn.heatmapとそんなに変わりません。
公式で紹介されている使い方。
>>> import numpy as np
>>> import matplotlib.pyplot as plt
>>> import statsmodels.graphics.api as smg
>>> hie_data = sm.datasets.randhie.load_pandas()
>>> corr_matrix = np.corrcoef(hie_data.data.T)
>>> smg.plot_corr(corr_matrix, xnames=hie_data.names)
>>> plt.show()
相関行列の計算からやってくれるわけではなく、例ではnumpyで計算しているようです。
これを踏まえて書いたコード。
import numpy as np
import pandas as pd
import matplotlib.pyplot as plt
from statsmodels.graphics.correlation import plot_corr

np.random.seed(0)
df = pd.DataFrame({"A":np.random.randint(0, 10, size=(10,)),
                   "B":np.random.randint(0, 10, size=(10,)),
                   "C":np.random.randint(0, 10, size=(10,))})

df_corr = df.corr()
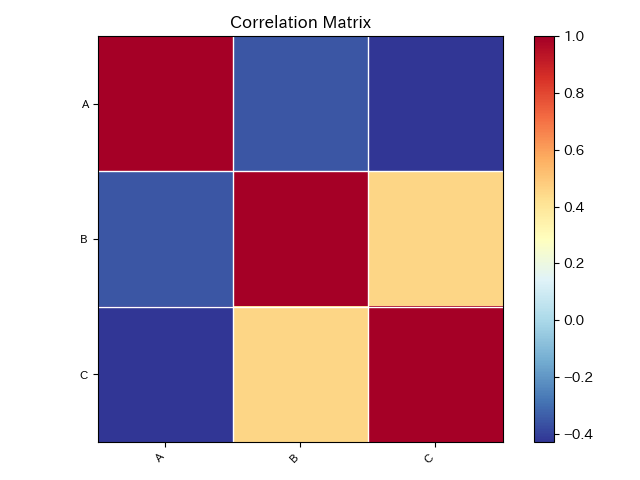
plot_corr(df_corr, xnames="ABC")
plt.savefig("statsmodels_cm.png")
満足の行く図にするためには、最低限xnamesを指定する必要があります。seaborn.heatmapでいうxticklabels, yticklabelsですね。iterableを渡せば良いようです。
結果。

見た目が少し違いますね。デフォルトのカラーマップはこっちの方が良いかも。
それだけ? と思ってリファレンスを見直したら、面白そうな引数が2つだけありました。
title
str, optional
The figure title. If None, the default (‘Correlation Matrix’) is used. If title='', then no title is added.
normcolor
bool or tuple of scalars, optional
If False (default), then the color coding range corresponds to the range of dcorr. If True, then the color range is normalized to (-1, 1). If this is a tuple of two numbers, then they define the range for the color bar.
normcolorはカラーマップの範囲を-1~1に一致させてくれるので、その方が良いと思います。同じことをseabornでできないか調べましたが、ぱっと見なさそうなので、アドバンテージです。
両方設定してみましょう。
plot_corr(df_corr, xnames="ABC", title="random", normcolor=True)

それなりに満足感のある結果。
まとめ
どうということはありませんが、欠点もなさそうだし、使いやすいのでこちらでやってもいいはず。
難点は、やはり名前が覚えづらいこと(importを書くときに迷う)くらいでしょうか。