【python】matplotlibで図の余白を調整する
matplotlibで図を描画するとき、余白に納得がいかないことがある。
調整方法を自分用にメモ。
余白の大きさを変える
plt.subplots_adjust()を使うと余白を調整できる。
ドキュメントによると、デフォルト値は以下の通り。
left  = 0.125  # the left side of the subplots of the figure
right = 0.9    # the right side of the subplots of the figure
bottom = 0.1   # the bottom of the subplots of the figure
top = 0.9      # the top of the subplots of the figure
wspace = 0.2   # the amount of width reserved for space between subplots,
               # expressed as a fraction of the average axis width
hspace = 0.2   # the amount of height reserved for space between subplots,
               # expressed as a fraction of the average axis height
matplotlib.pyplot.subplots_adjust — Matplotlib 3.0.2 documentation
たとえば次のようなコードを実行すると、結果は下の図のようになる。わかりやすいように背景を着色している。
import numpy as np
import matplotlib.pyplot as plt

x = np.linspace(0, 10, 100)
y = np.sin(x)

plt.figure()
plt.plot(x, y)
plt.savefig("result.png", facecolor="azure")

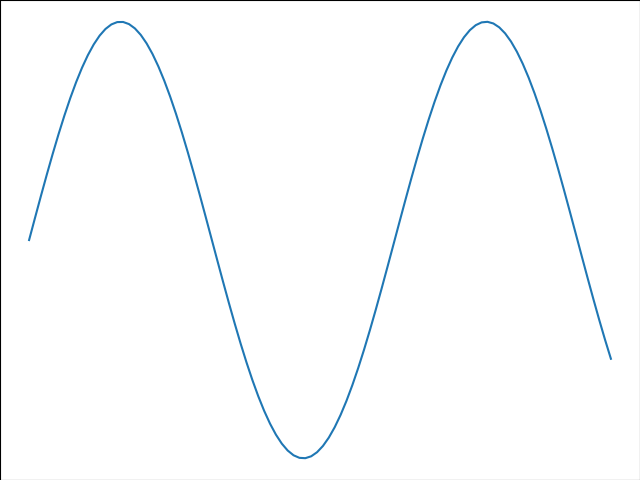
余白を削れるだけ削ってみる。
import numpy as np
import matplotlib.pyplot as plt

x = np.linspace(0, 10, 100)
y = np.sin(x)

plt.figure()
plt.plot(x, y)
plt.subplots_adjust(left=0, right=1, bottom=0, top=1)
plt.savefig("result.png", facecolor="azure")

納得がいかないが、こうなるものは仕方ない。適当に調整する。
import numpy as np
import matplotlib.pyplot as plt

x = np.linspace(0, 10, 100)
y = np.sin(x)

plt.figure()
plt.plot(x, y)
plt.subplots_adjust(left=0.1, right=0.95, bottom=0.1, top=0.95)
plt.savefig("result.png", facecolor="azure")

それらしくなった。
スポンサーリンク
余白をギリギリまで詰める
plt.savefig()の引数でbbox_inches='tight', pad_inches=0を指定する。
plt.subplots_adjust()で手動で調整しても良いけど、savefigでファイルに出力したい場合はこちらの方が実用的。論文やパワポに載せる図などを作る際に便利なのだと思う。
matplotlib.pyplot.savefig — Matplotlib 3.0.2 documentation
import numpy as np
import matplotlib.pyplot as plt

x = np.linspace(0, 10, 100)
y = np.sin(x)

plt.figure()
plt.plot(x, y)
plt.savefig("result.png", facecolor="azure", bbox_inches='tight', pad_inches=0)

subplotsの間の余白を調整する
複数のグラフを描画しているときに、余白が狭くなることがよくある。図ごとにタイトルや軸ラベルを付けたりすると基本的にそうなる。
import numpy as np
import matplotlib.pyplot as plt

x = np.linspace(0, 10, 100)
y1 = np.sin(x)
y2 = np.cos(x)

fig, axes = plt.subplots(nrows=2, ncols=1)
axes[0].plot(x, y1)
axes[0].set_title("y = sin(x)")
axes[1].plot(x, y2)
axes[1].set_title("y = cos(x)")
plt.savefig("result.png")

plt.subplots_adjust()で調整できる。wspaceが横方向、hspaceが縦方向の余白に対応。
import numpy as np
import matplotlib.pyplot as plt

x = np.linspace(0, 10, 100)
y1 = np.sin(x)
y2 = np.cos(x)

fig, axes = plt.subplots(nrows=2, ncols=1)
axes[0].plot(x, y1)
axes[0].set_title("y = sin(x)")
axes[1].plot(x, y2)
axes[1].set_title("y = cos(x)")
plt.subplots_adjust(hspace=0.4)
plt.savefig("result.png")
このように改善する。
