【python】matplotlib.cmの使い方を説明しようと思う
テーマ
matplotlib.cmが直接使うことはない謎の技術と思われがちなので、「普通に可愛い子なんですよ」って説明する。
cm (colormap) — Matplotlib 3.0.2 documentation
スポンサーリンク
cmとは何か
とりあえずmatplotlib.cmの属性に何があるか見てみましょう。ちなみに、属性は組み込み関数dir()で見れます。
>>> import matplotlib.cm as cm
>>> dir(cm)
['Accent', 'Accent_r', 'Blues', 'Blues_r', 'BrBG', 'BrBG_r', 'BuGn', 'BuGn_r', 'BuPu', 'BuPu_r', 'CMRmap', 'CMRmap_r', 'Dark2', 'Dark2_r', 'GnBu', 'GnBu_r', 'Greens', 'Greens_r', 'Greys', 'Greys_r', 'LUTSIZE', 'OrRd', 'OrRd_r', 'Oranges', 'Oranges_r', 'PRGn', 'PRGn_r', 'Paired', 'Paired_r', 'Pastel1', 'Pastel1_r', 'Pastel2', 'Pastel2_r', 'PiYG', 'PiYG_r', 'PuBu', 'PuBuGn', 'PuBuGn_r', 'PuBu_r', 'PuOr', 'PuOr_r', 'PuRd', 'PuRd_r', 'Purples', 'Purples_r', 'RdBu', 'RdBu_r', 'RdGy', 'RdGy_r', 'RdPu', 'RdPu_r', 'RdYlBu', 'RdYlBu_r', 'RdYlGn', 'RdYlGn_r', 'Reds', 'Reds_r', 'ScalarMappable', 'Set1', 'Set1_r', 'Set2', 'Set2_r', 'Set3', 'Set3_r', 'Spectral', 'Spectral_r', 'Vega10', 'Vega10_r', 'Vega20', 'Vega20_r', 'Vega20b', 'Vega20b_r', 'Vega20c', 'Vega20c_r', 'Wistia', 'Wistia_r', 'YlGn', 'YlGnBu', 'YlGnBu_r', 'YlGn_r', 'YlOrBr', 'YlOrBr_r', 'YlOrRd', 'YlOrRd_r', '__builtins__', '__cached__', '__doc__', '__file__', '__loader__', '__name__', '__package__', '__spec__', '_deprecation_datad', '_generate_cmap', '_reverse_cmap_spec', '_reverser', 'absolute_import', 'afmhot', 'afmhot_r', 'autumn', 'autumn_r', 'binary', 'binary_r', 'bone', 'bone_r', 'brg', 'brg_r', 'bwr', 'bwr_r', 'cbook', 'cmap_d', 'cmapname', 'cmaps_listed', 'colors', 'cool', 'cool_r', 'coolwarm', 'coolwarm_r', 'copper', 'copper_r', 'cubehelix', 'cubehelix_r', 'datad', 'division', 'flag', 'flag_r', 'get_cmap', 'gist_earth', 'gist_earth_r', 'gist_gray', 'gist_gray_r', 'gist_heat', 'gist_heat_r', 'gist_ncar', 'gist_ncar_r', 'gist_rainbow', 'gist_rainbow_r', 'gist_stern', 'gist_stern_r', 'gist_yarg', 'gist_yarg_r', 'gnuplot', 'gnuplot2', 'gnuplot2_r', 'gnuplot_r', 'gray', 'gray_r', 'hot', 'hot_r', 'hsv', 'hsv_r', 'inferno', 'inferno_r', 'jet', 'jet_r', 'ma', 'magma', 'magma_r', 'mpl', 'nipy_spectral', 'nipy_spectral_r', 'np', 'ocean', 'ocean_r', 'os', 'pink', 'pink_r', 'plasma', 'plasma_r', 'print_function', 'prism', 'prism_r', 'rainbow', 'rainbow_r', 'register_cmap', 'revcmap', 'seismic', 'seismic_r', 'six', 'spectral', 'spectral_r', 'spring', 'spring_r', 'summer', 'summer_r', 'tab10', 'tab10_r', 'tab20', 'tab20_r', 'tab20b', 'tab20b_r', 'tab20c', 'tab20c_r', 'terrain', 'terrain_r', 'unicode_literals', 'viridis', 'viridis_r', 'winter', 'winter_r']
「アホ・・・」と思われた方もいるかもしれませんが、実際にこうなっています。すべてのカラーマップに対応する属性があります。
ではカラーマップ自体と、その型を見ましょう。
>>> cm.Paired
<matplotlib.colors.ListedColormap object at 0x7fea0de2b2b0>
>>> type(cm.Paired)
<class 'matplotlib.colors.ListedColormap'>
あまり参考にならなかったですね・・・でも実はこれのhelpには深いことが書いてあります。
>>> help(cm.Paired)
# 中略
 |  __call__(self, X, alpha=None, bytes=False)
 |      Parameters
 |      ----------
 |      X : scalar, ndarray
 |          The data value(s) to convert to RGBA.
 |          For floats, X should be in the interval ``[0.0, 1.0]`` to
 |          return the RGBA values ``X*100`` percent along the Colormap line.
 |          For integers, X should be in the interval ``[0, Colormap.N)`` to
 |          return RGBA values *indexed* from the Colormap with index ``X``.
 |      alpha : float, None
 |          Alpha must be a scalar between 0 and 1, or None.
 |      bytes : bool
 |          If False (default), the returned RGBA values will be floats in the
 |          interval ``[0, 1]`` otherwise they will be uint8s in the interval
 |          ``[0, 255]``.
 |
 |      Returns
 |      -------
 |      Tuple of RGBA values if X is scalar, othewise an array of
 |      RGBA values with a shape of ``X.shape + (4, )``.
__call__というのは、インスタンスを関数っぽく呼び出したときに呼ばれるメソッドです。そしてそれぞれのカラーマップは、クラスではなくオブジェクト(インスタンス)としてmatplotlib.cmの属性になっています。つまり呼ぶことができます。
__call__自体の内容は、0.0から1.0までの値を引数に取り、RGBAのタプル等に変換して返すというものです。配列もnumpyのユニバーサル関数と同様に受け付けます。
ということは? こうやって使えます。
>>> cm.Paired(0)
(0.6509803921568628, 0.807843137254902, 0.8901960784313725, 1.0)
>>> cm.Paired(1)
(0.12156862745098039, 0.47058823529411764, 0.7058823529411765, 1.0)
>>> cm.Paired([0,0.5,1])
array([[0.65098039, 0.80784314, 0.89019608, 1.        ],
       [0.99215686, 0.74901961, 0.43529412, 1.        ],
       [0.69411765, 0.34901961, 0.15686275, 1.        ]])
もうお分かり頂けましたね。この機能は、その気になればmatplotlib.pyplotと組み合わせなくても使えるようなものになっています。独立性があるのです。
スポンサーリンク
実践編
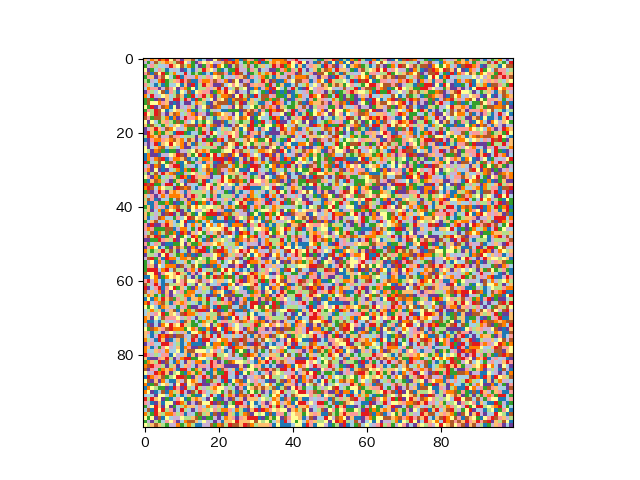
とりあえず乱数列を生成し、適当にplotして画像として保存してみます。
import numpy as np
import matplotlib.cm as cm
import matplotlib.pyplot as plt

np.random.seed(0)
a = np.random.random((100,100))*100

plt.figure()
plt.imshow(a, cmap=cm.Paired)
plt.savefig("a.png")

この結果自体は特に意味とかはないんですが。ここでどんな処理が走っているのかを追いかけて、matplotlibのplot機能を使わずに同じ画像を再現してみようと思います。
とりあえず、入力の配列はcm.Pairedに渡ってRGBAに変換されています。それはそれで良いとして、入力の配列は(概ね)0~100のスケールになっているはずです。カラーマップのインスタンスの引数には0~1を指定してあげる必要があると、上で理解しました。誰がスケーリングしているのでしょう?
愚直にmatplotlib.cmのドキュメントを読みに行きます。
cm (colormap) — Matplotlib 3.0.2 documentation
norm : matplotlib.colors.Normalize instance
The normalizing object which scales data, typically into the interval [0, 1]. If None, norm defaults to a colors.Normalize object which initializes its scaling based on the first data processed.
わかりました。まあ、違うクラス(ScalarMappable)の引数っぽいんですが、とにかくこれを使っておけば良いのね。
matplotlib.colors.Normalize — Matplotlib 3.0.2 documentation
まあ、これは適当に眺めておきます。難しいこと何も書いてないし。
ちょっと色々やってみましょう。
>>> from matplotlib.colors import Normalize
>>> import matplotlib.cm as cm
>>> Normalize()([100.0, 30.0, 0.0])
masked_array(data=[1. , 0.3, 0. ],
             mask=False,
       fill_value=1e+20)
>>> cm.Paired(Normalize()([100.0, 30.0, 0.0]))
array([[0.69411765, 0.34901961, 0.15686275, 1.        ],
       [0.2       , 0.62745098, 0.17254902, 1.        ],
       [0.65098039, 0.80784314, 0.89019608, 1.        ]])
>>> sm = cm.ScalarMappable(norm=None, cmap=cm.Paired)
>>> sm.to_rgba([100.0, 30.0, 0.0])
array([[0.69411765, 0.34901961, 0.15686275, 1.        ],
       [0.2       , 0.62745098, 0.17254902, 1.        ],
       [0.65098039, 0.80784314, 0.89019608, 1.        ]])
まあ、使えそうという感触があります。
では、上と同じ画像をmatplotlib.pyplotに依存しないで生成し、画像ファイルとして保存してみましょう。pltの代わりにPILを使います。
import numpy as np
import matplotlib.cm as cm
from PIL import Image

np.random.seed(0)
a = np.random.random((100,100))*100

sm = cm.ScalarMappable(norm=None, cmap=cm.Paired)
im_array = sm.to_rgba(a, bytes=True)
Image.fromarray(im_array).save("b.png")

できました。このように使えます(枠とか画像サイズとかは勘弁してください・・・)。
まとめ
この記事みたいなことを実際にやる必要があるか? というと微妙ですが、matplotlib.cmの実装自体はわかりやすいものだ、ということを理解してもらえたと思います。
皆さんも、matplotlib.cmのいろいろな可愛がり方を工夫してあげてはいかがでしょうか*1。
*1:たとえばこういう風に使っている人がいて、かっこいいなーと思ったりする訳です: matplotlibで色をグラデーション的に選択 - Qiita